Brief 1
Flaws of the smart city
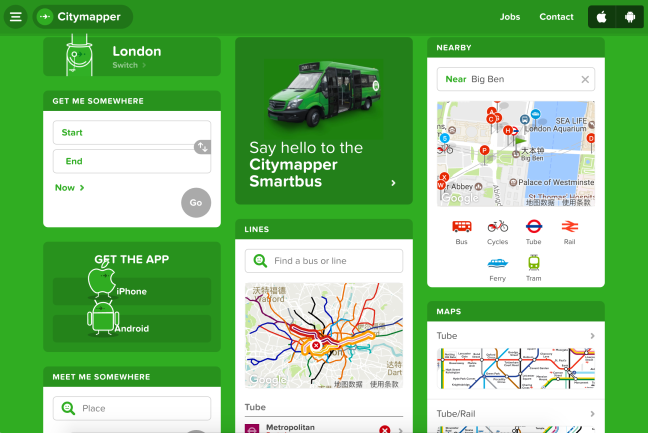
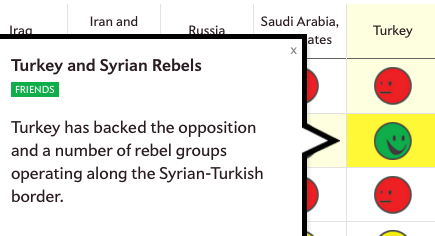
By embedding sensors in the streets, the smart city is under constant surveillance. People’s activities are tracked and recorded by CCTV anytime and anywhere. This studio session looks at the social role and ethical practices of speculative critical design. Even someone took a picture of you while you are out on the streets they can scan it and cross-reference it against photo databases to get a match. With the city becoming more and more transparent, privacy is a major concern and speculative critical design can help to connect people to privacy issues which appear incredibly complex. Mapping, drawing, collage , prototype, collect, making a zine and creating data wall can help designers to form strategies that are realistic and empathetic. Finally, the presentation from Studio Kin encompassed everything we’ve learnt in this studio and how these skills are implemented in the industry today.
The most useful and interesting insight I have gained from this studio is the importance of research methods for communication design. Before this journey, design research (for me) was about collecting texts, images to make mood boards. Without downgrading the importance of these methods, there is a lot more to research than that. In the design for the flaws of smart city studio I have gained an understanding of specific research methods such as quick drawing, collage, case studies, creating research zine, especially making a design fiction. These methods help designers understand the complexity of the problems and then develop strategies for speculative critical design to the flaws of smart city that actually have some validity and meaning. These ways of creating design fiction were very helpful in speculative critical design.
In the speculative critical design for smart city I have changed my design thinking that the designer no longer attempts to generate answers, but instead aims to formulate really great questions. Design fiction can be understood as both a discipline and a method for my future design practice, because design fiction focuses on the methodological approach, the functional characteristic of the method can be described as a way to envision new strategies in the distant future. It can help me identify insights gained through critical incidents in the design process and activities in the future practice. This field of practice is not futile and that I can continue to develop my skills in speculative critical thinking for design challenge and sustainable design strategies.
Reference:
What is design fiction https://www.quora.com/What-is-design-fiction
Bruce Sterling: Interactions Article on Design Fictions:http://dl.acm.org/citation.cfm?id=1516021
Brent, Bill:Make a zine! : a guide to self-publishing disguised as a book on how to produce a zine
Brief 2
Data visualization
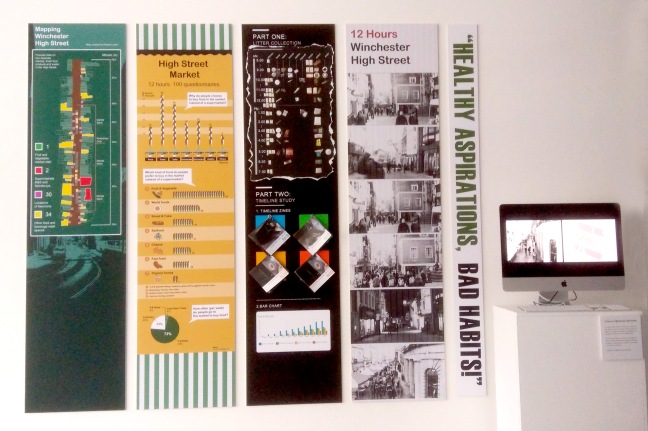
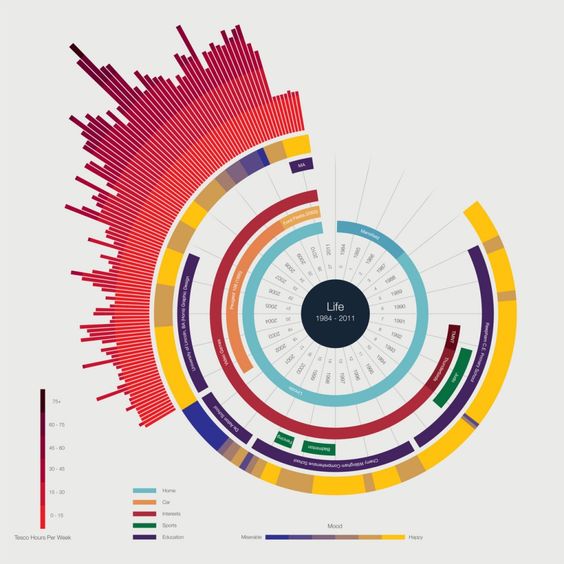
Design for using data to tell a story in a visual way, in my study the story is about one-way traffic system in Winchester. The studio looked at practices of designing data visualization. The One-way traffic system is normal in our daily lives. I think the project requires in-depth use of data to tell a story or deliver information. Mapping and case studies are useful tools for us to create data visualization. By studying good examples, we gain some principles creating data visualization. A good data visualization design is distinguished by three main key points, visualization, story telling, and interactivity. And I find the more you incorporate the components into your content, the better the data visualization.
My specific insight from this studio is how to efficiently tell a clear story. The audience wants to know the story or knowledge derived from our data visualization. This is important in this studio because we need to design an exhibition of the end of brief 2. My initial strategy focuses on the form of the data visualization. This turned out to be wrong. I realized my strategy actually required a great consideration of content rather than form. In the Design for data visualization for one-way traffic system I have gained an understanding of using visual language to tell a story. These principle helps a designer understand the design brief, and create a efficient and useful design. By building skills in case studying, And a good example can give you a lot of inspiration, you can immediately learn some of the design skills and knowledge. For example, color matching, how to set the font size, the locations of text blocks, etc. I think this studio has challenged and strengthened a range of my personal and professional skills as a designer: how my story can appeal to the target audience, how they might interact with the strategy and how I can develop a long-term connection between my strategy and the audience.
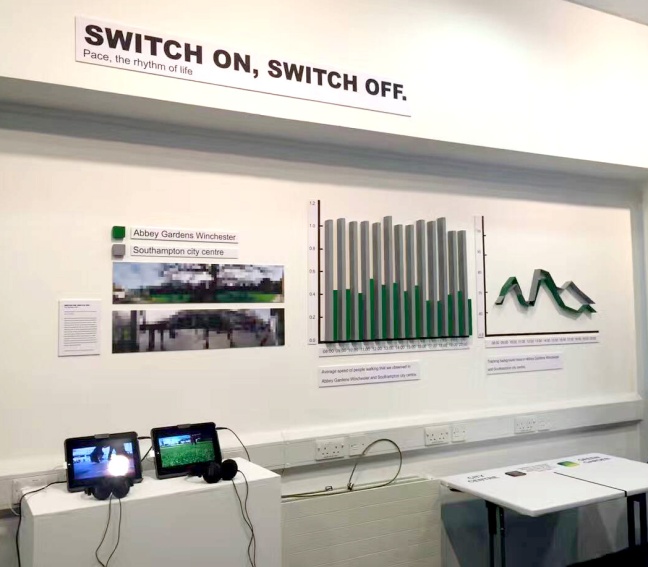
In the Design for data visualization I have changed my approach to design from a focus on things to a focus on ways. The data visualization makes recognizing this pattern and outliers as easy as watching a short time-lapsed video. people can easily consume the data if it is properly visualized. This is a useful tool for people to analyse data, find out problems, and receive specific insights in real lives.
Brief 3
Collect
This studio session, design for collect, looks at collecting a variety of research material relevant to my final project topic. Tangible media is my final project topic. Tangible media is a complex topic into practical outcomes, so it requires in-depth research on this knowledge for me to deepen my understanding of the topic, define an area of focus and establish the problems that will drive my final project. Quantitative and qualitative collection, case studies, and Pecha Kucha as tools help designer to form strategies that drive my final project. All of this helped me develop a deeper, personal understanding of the strategy, which I felt, was conveyed in my final project. The new knowledge, Pecha Kucha, will be used in my future practice.
The most useful and interesting insight I have gained from IDEO method. Before this journey, design research (for me) was about making mood boards and identifying basic issue. Without downgrading the importance of these methods, I now recognize that there can be a lot more to research than that. I think IDEO method is a useful tool to inspire design, because it also keeps people at the center of my work. From this methods I have gained an understanding of specific research methods such as extreme user interviews, experience prototype and camera journal. These ways of the extreme user interviews is very helpful in designing my final project.
Brief 4
Research magazine
This studio session, research magazine, looks at using the publishing process to comprehend final research and establish a clear brief for understanding my final project.
The most useful and interesting insight I have gained from this studio is the importance of identifies the communication design problems. Before this journey, I think that create a design magazine only need to put the image of art works in the magazine, with the text about the inspiration of the work process, and the meaning of the works. Without downgrading the importance of design challenge, I now recognise that there can be a lot more to research than that. My initial strategy does not pay more attention to identify the problems and insights. I was trying to think about the form or materials of my final exhibition. And also I did not make very clear correlations between tangible media and long-distance relationship. I realized my strategy required a great consideration of finding an interesting insight from my topic. By building skills in mapping I made very clear correlations between tangible media and long-distance relationship. Strengthening my skills in interviewing and researching helped me to develop a persona understanding in this area. Design challenge is human-centered; it requires in-depth research on people and issues that affect them. So identify a problems and issue which is very important and useful for my future design. I think a good design work should aim to develop an innovative solution to a problem rather than a beautiful design work.
All of this will help me develop a deeper, personal understanding of the strategy. My new understanding of design challenge will be used in my future practice.
Reference: How To Properly Frame Your Design Challenge https://medium.com/digital-experience-design/how-to-properly-frame-your-design-challenge-36104910dfc8


 Today, I am going to design science museum, find out something interesting. There are a lot